

New Marquette University Law School Poll: Clinton leads Trump, 46% to 40%
New Marquette University Law School Poll: Clinton leads Trump, 46% to 40%
New Marquette University Law School Poll: Clinton leads Trump, 46% to 40%
MILWAUKEE -- Wisconsin Republicans will likely focus their efforts on U.S. Sen. Ron Johnson's re-election bid after the Marquette University Law School Poll released on Wednesday, November 2nd (less than one week before election day) showed Johnson dramatically outperforming Republican presidential nominee Donald Trump in Wisconsin.
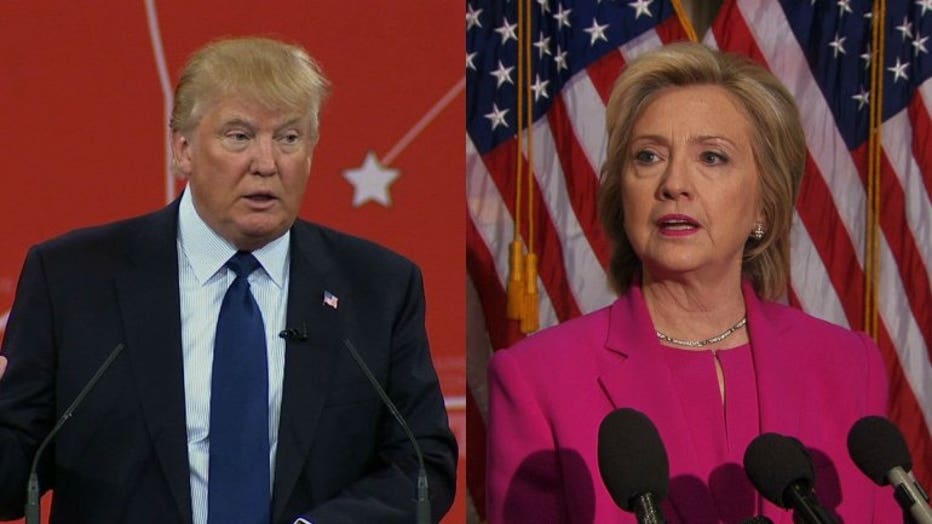
Democrat Hillary Clinton leads Trump, 46-40, among likely voters -- virtually unchanged from a poll conducted three weeks earlier, despite the news that the FBI has found new emails that may be relevant to the investigation of Clinton's private email server.
Clinton's lead shrank five points when comparing responses before the FBI's announcement Friday, October 30th to those polled after the news broke. In comparison, Trump's numbers plummeted by 20 points three weeks ago after the release of audio and video on which he bragged about groping a woman.
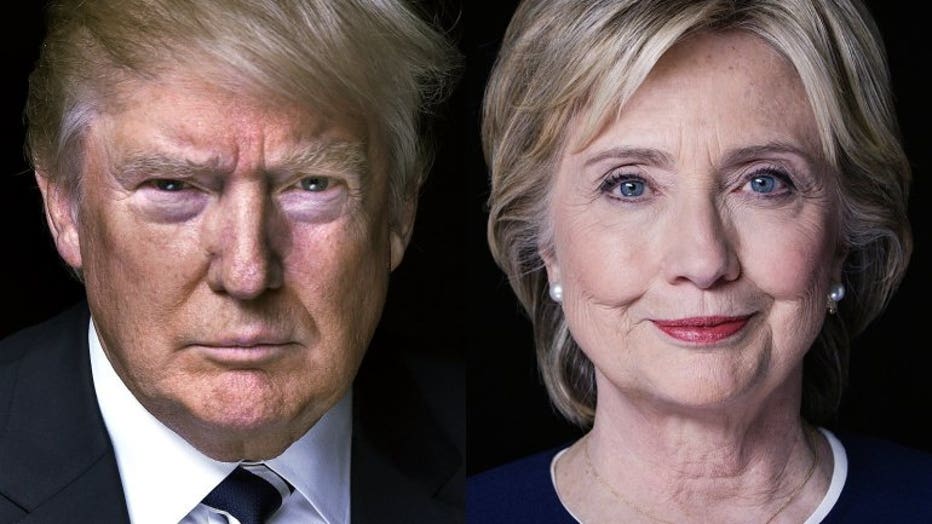
Presidential candidates Donald Trump and Hillary Clinton.
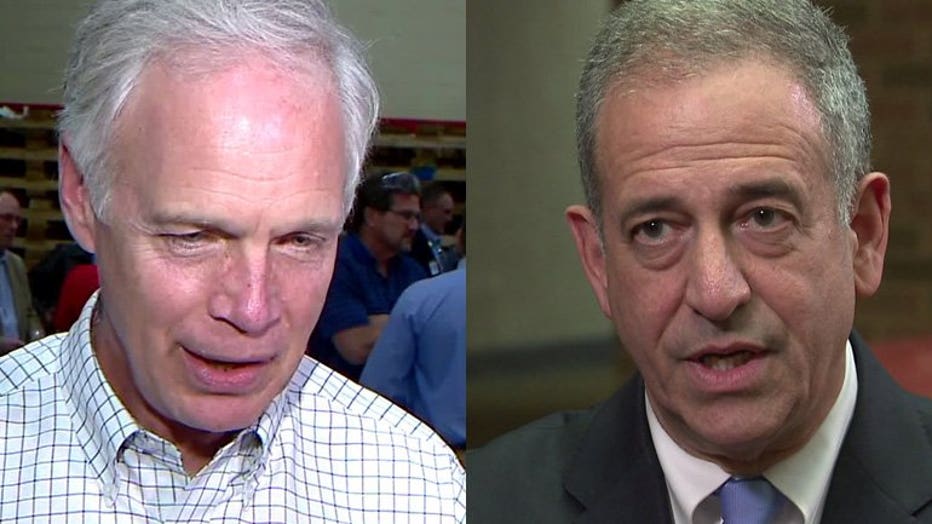
Johnson's U.S. Senate race with Democrat Russ Feingold continues to tighten, with Feingold now holding a 45-44 lead -- a virtual tie six days before the election. The numbers explain why a flurry of outside advertisers on both sides have flooded the TV airwaves with ads in recent days.
Johnson is considered one of the most likely Republican senators to lose his seat, and national Republicans expressed both surprise and hope on Twitter after the MU Law Poll results were released Wednesday.
Meanwhile, Wisconsin Republicans expressed the need to focus on Johnson's race to push him over the finish line.
"Attention Wisconsin Republicans: Unite and focus all your energy here. Ron Johnson can win!" tweeted Brian Fraley, a GOP strategist who supports Johnson but opposes Trump.

Ron Johnson/Russ Feingold
Below is a complete analysis of the latest Marquette University Law School poll, as released by poll officials:
A new Marquette Law School Poll finds 46 percent of Wisconsin likely voters supporting Democratic candidate Hillary Clinton and 40 percent supporting Republican Donald Trump in the race for president. Libertarian Gary Johnson is supported by 4 percent and Green Party candidate Jill Stein by 3 percent. Six percent do not express a preference, saying that they will vote for neither candidate, will not vote or don’t know how they will vote.
In the most recent Marquette Law School Poll, conducted Oct. 6-9, Clinton received 44 percent, Trump 37 percent, Johnson 9 percent and Stein 3 percent, with 6 percent not expressing a preference.
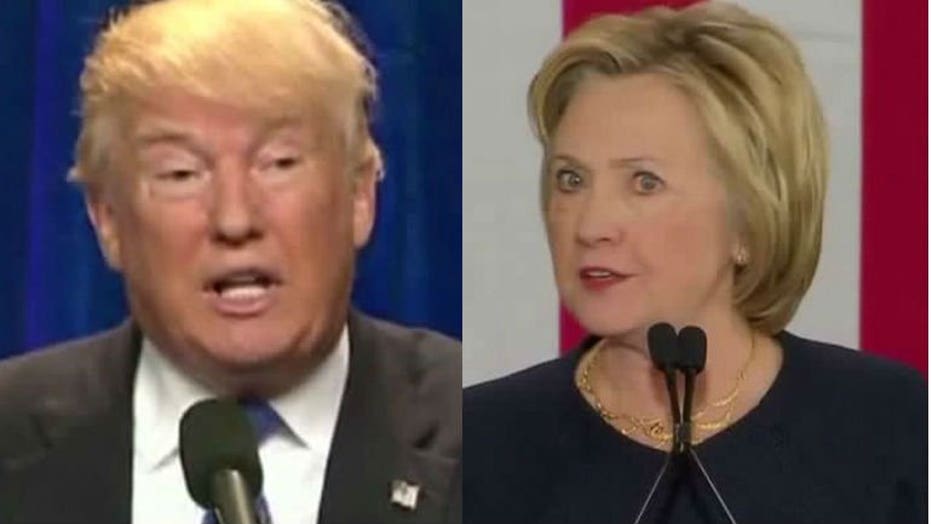
Donald Trump and Hillary Clinton
The new survey, the final Marquette Law School Poll to be conducted before the Nov. 8 election, additionally finds a very close U.S. Senate race in Wisconsin, with 45 percent of likely voters supporting Democrat Russ Feingold and 44 percent supporting Republican Ron Johnson. Libertarian candidate Phil Anderson has 3 percent support, while 5 percent do not express a candidate preference, saying that they will vote for none of the candidates, will not vote or don’t know how they will vote. In the poll conducted Oct. 6-9, Feingold held 46 percent to Johnson’s 44 percent, with Anderson at 4 percent and 5 percent without a preference.
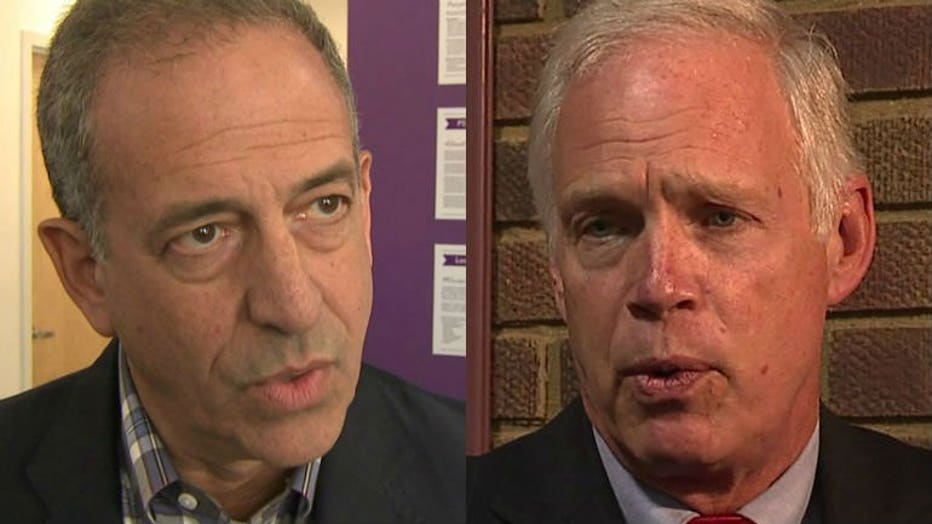
Russ Feingold, Ron Johnson
In the presidential race, undecided and third-party voters are evenly divided along partisan lines. Among those not choosing a major-party presidential candidate, 42 percent are Republicans and 43 percent are Democrats, with 15 percent saying that they are independent or identify with other parties. Among those not choosing a major-party Senate candidate, 39 percent are Republicans and 38 percent are Democrats, with 23 percent saying that they are independent or identify with some other party.
Early voters make up 16 percent of the sample consisting of those likely to vote or who have already voted. Among early voters, Clinton receives 64 percent to 25 percent for Trump, 1 percent for Johnson and no votes for Stein. Six percent of early voters declined to say how they voted, and 3 percent said they voted for someone else. Among early voters for the Senate, Feingold receives 58 percent, Johnson 29 percent and Anderson 2 percent. Eight percent declined to say how they voted, and 3 percent said they voted for someone else. One percent said they did not vote for the Senate. The Wisconsin Elections Commission reported Tuesday that 518,600 early ballots had been cast, which would have been 16.9 percent of the 2012 presidential turnout of 3.071 million voters.
The full sample of the Oct. 26-31 survey comprises 1,401 registered voters interviewed by cell phone or landline, with a margin of error of +/- 3.3 percentage points. Results for likely voters are based on 1,255 respondents, with a margin of error of +/- 3.5 percentage points.
Shifts following news of FBI investigation of Clinton emails
The poll began interviewing voters on Wednesday, Oct. 26, and continued through Monday, Oct. 31. News of the FBI’s informing Congress that it is investigating recently discovered emails related to Clinton’s private email server was released during this period: specifically, on Friday, Oct. 28. The sample can be divided by day of interview before or after that news, and comparing voter responses by the day of the interviews allows an estimate of how voters responded to this news. The margin of error is +/- 5.3 percentage points for Wednesday and Thursday‘s sample (541 respondents), +/-9.8 percentage points for the Friday sample (157 respondents) and +/-5.4 percentage points for the combined Saturday, Sunday and Monday samples (557 respondents).
Combining all interviews, 50 percent say they are bothered a lot by Clinton’s use of a private email server while she was secretary of state, 23 percent say they are bothered a little and 26 percent say this doesn’t bother them at all.
In interviews conducted Wednesday and Thursday, before the news of the FBI investigation, the responses were 50 percent bothered a lot, 23 percent bothered a little and 26 percent not bothered at all, the same as the overall results. In Friday interviews, mostly conducted after the news was released, 60 percent said they were bothered a lot, 18 percent bothered a little and 22 percent not bothered. In interviews completed Saturday, Sunday or Monday, 48 percent said the use of the private email server bothered them a lot, 24 percent said they were bothered a little and 28 percent said they were not bothered at all.
In Wednesday and Thursday interviews, 47 percent favored Clinton and 36 percent favored Trump. In Friday interviews, Trump was supported by 48 percent and Clinton by 40 percent. Interviews completed Saturday through Monday found Clinton with a 46 percent to 40 percent advantage over Trump.
When results are broken down by party identification, there is little change among Democrats, who supported Clinton by 88 percent on Wednesday and Thursday, 88 percent on Friday and 90 percent Saturday through Monday. Among Democrats, Trump received 6 percent, 2 percent and 3 percent on those days respectively.
Among Republicans, Trump received 73 percent support on Wednesday and Thursday, 87 percent on Friday and 86 percent on Saturday through Monday, with Clinton receiving 8 percent, 9 percent and 4 percent among Republicans on those days.
Independents shifted from a 41 percent to 34 percent Clinton advantage over Trump on Wednesday and Thursday, to a 44 percent to 34 percent Trump advantage over Clinton on Friday and a 43 percent to 35 percent Trump advantage in Saturday through Monday interviews.
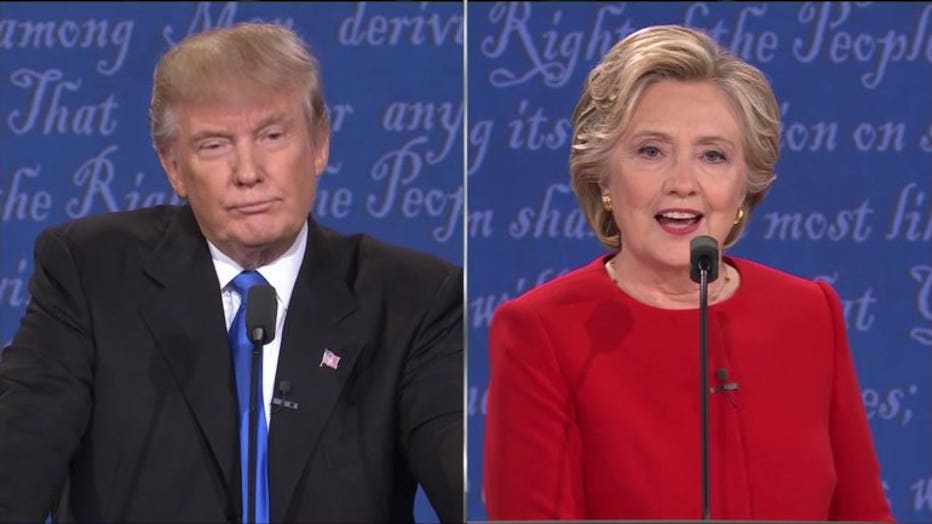
Hillary Clinton/Donald Trump: First presidential debate
For comparison, the Senate vote shifted little over those days, with a 45 to 45 tie in Wednesday and Thursday interviews, a 47-40 Johnson advantage on Friday and a 46-42 Feingold advantage in Saturday through Monday interviews.
“Concern about Clinton’s use of a private email system does not appear to have shifted much in the wake of the FBI news. The vote margin overall shows a little tightening, from an 11-point Clinton lead before the news to a 6-point lead after the news,” said Charles Franklin, director of the Marquette Law School Poll and professor of law and public policy. “Within partisan identifiers, there is evidence that some undecided Republicans moved to support of Trump over the survey period and that independents shifted from a Clinton advantage to a Trump advantage, though all the shifts are inside the margin of error.”
Gender and education gaps
Among likely voters, 46 percent of men support Trump and 41 percent support Clinton. Among women, Clinton is supported by 50 percent and Trump by 34 percent. Johnson receives 4 percent among each gender and Stein is supported by 2 percent of men and 3 percent of women.
Within the parties, the gender gap persists among Republicans, with 86 percent of men supporting Trump compared to 76 percent of women, and Clinton getting 6 percent of the vote from men and 7 percent from women. Differences among Democrats are small, with 88 percent of Democratic men and 90 percent of Democratic women supporting Clinton, while 3 percent of Democratic men and 5 percent of women say they will vote for Trump. There is a larger gender gap among independents, with Trump leading 45 percent to 37 percent among men and Clinton leading 39 percent to 32 percent among women.
An education gap among non-Hispanic whites has developed in this year’s polling. The new poll finds that 45 percent of non-Hispanic whites without a college degree support Trump while 41 percent support Clinton. Among non-Hispanic whites with a college degree, Clinton is supported by 46 percent and Trump by 39 percent.
Comparison of candidate traits
Asked if “honest” describes Clinton, 28 percent of likely voters say that it does, while 68 percent say that it does not. For Trump, 36 percent say “honest” describes him, while 61 percent say it does not. In the Oct. 6-9 poll, 29 percent of likely voters described Clinton as honest and 66 percent did not. Thirty-three percent described Trump as honest in that poll, while 64 percent did not.
Forty-seven percent of likely voters describe Clinton as someone who “cares about people like me” and 51 percent do not. Thirty-seven percent say Trump cares about people like them while 61 percent do not see him this way. In the previous poll, 47 percent described Clinton as caring while 50 percent did not. In that poll, 35 percent said Trump cares while 61 percent did not see him that way.
Asked if a candidate has the qualifications to be president, 59 percent say Clinton does, while 39 percent say she does not. Thirty-five percent say Trump has the qualifications to be president, while 61 percent say he does not. In early October, 58 percent described Clinton as qualified and 40 percent said she was not, while 33 percent described Trump as qualified and 65 percent said he was not.
Forty-seven percent of likely voters say “shows good judgment” describes Clinton, while 51 percent say it does not. For Trump, 28 percent say “shows good judgment” describes him, with 70 percent saying it does not. In the Oct. 6-9 poll, 48 percent said Clinton shows good judgment while 50 percent did not. For Trump in the previous poll, 28 percent said he shows good judgment and 70 percent did not.
Respondents were asked how comfortable they were with the idea of each candidate as president. Forty-seven percent of likely voters say they are very or somewhat comfortable with Clinton as president, with 52 percent very or somewhat uncomfortable, including 42 percent saying they are “very uncomfortable.” For Trump, 39 percent say they are very or somewhat comfortable with him as president, while 62 percent say they are very or somewhat uncomfortable, including 51 percent saying “very uncomfortable.” In the previous poll, 46 percent were very or somewhat comfortable with Clinton and 53 percent were very or somewhat uncomfortable. For Trump in early October, 35 percent were very or somewhat comfortable and 63 percent were very or somewhat uncomfortable.
Donald Trump and Hillary Clinton
Views of Senate candidates
Partisans remain strongly aligned with their Senate nominees, with 86 percent of Republicans backing Johnson and 85 percent of Democrats supporting Feingold. In the Oct. 6-9 poll, 89 percent of Republicans favored Johnson and 90 percent of Democrats supported Feingold. In the new poll, six percent of Republicans said they would vote for Feingold while 8 percent of Democrats said they would vote for Johnson. In the previous poll, Feingold received 7 percent of the Republican vote and Johnson got 5 percent of the Democratic vote.
Independents give Johnson a 46 percent edge to Feingold’s 40 percent, a reversal of the previous poll in which independents leaned to Feingold by 44 percent to 37 percent for Johnson.
Sen. Ron Johnson, Russ Feingold
Forty-five percent describe Johnson as someone who “cares about people like me,” while 41 percent say this does not describe him, unchanged from the previous poll. Forty-nine percent describe Feingold as caring about people like them, while 39 percent say that this does not describe him. Three weeks ago, 52 percent said Feingold cares and 36 percent said he did not.
Fifty percent say “honest” describes Johnson and 33 percent say it does not. Fifty percent say “honest” describes Feingold and 39 percent say it does not. In the previous poll, 49 percent said “honest” described Johnson and 33 percent said it did not. For Feingold, 52 percent described him as honest while 36 percent did not in the previous poll.
Among all likely voters, 43 percent have a favorable view of Johnson, 40 percent hold an unfavorable view and 18 percent say they haven’t heard enough or don’t know how they view him. Feingold is viewed favorably by 46 percent, unfavorably by 42 percent, and 12 percent say they lack an opinion of him. Anderson is viewed favorably by 3 percent, unfavorably by 6 percent, and 90 percent lack an opinion of him. In September, Johnson was seen favorably by 43 percent of likely voters and unfavorably by 37 percent, with 20 percent lacking an opinion. Feingold was viewed favorably by 45 percent and unfavorably by 40 percent, with 15 percent lacking an opinion of him. In the previous poll, 4 percent had a favorable view of Anderson, 7 percent an unfavorable view and 89 percent did not have an opinion of him.
Concerns about presidential candidates
Fifty-two percent of registered voters say that the video of Trump talking about his treatment of women “bothers them a lot,” while 23 percent say it bothers them a little and 23 percent say this doesn’t bother them. This is similar to the 50 percent who say they are bothered a lot by Clinton’s use of a private email server, with 23 percent bothered a little and 26 percent who say they are not bothered by it.
Asked about a leaked email quoting Clinton as saying politicians must have a public agenda and a private one, 41 percent say this bothers them a lot, 27 percent say it bothers them a little and 29 percent say it does not bother them.
Forty-two percent say they are bothered a lot by Trump’s decision not to release his tax returns, while 20 percent are bothered a little and 38 percent are not bothered about this.
Seventy-five percent of registered voters say Trump has the physical capacity to meet the demands of the presidency, while 21 percent say he does not. Sixty-seven percent say Clinton has the physical capacity for the presidency while 28 percent say she does not.
Issues regarding the election
Thirty-eight percent of registered voters say that they are very confident the votes for president will be accurately counted, with 30 percent somewhat confident, 18 percent not very confident and 12 percent not at all confident. Among Republicans, 22 percent are very confident the vote will be accurately counted, 36 percent somewhat confident, 28 percent not very confident and 13 percent not at all confident. Among Democrats, 57 percent are very confident of an accurate vote count, with 25 percent somewhat, 11 percent not very and 6 percent not at all confident in the vote count. Thirty-six percent of independents are very confident of an accurate count, with 30 percent somewhat, 18 percent not very and 16 percent not at all confident in the accuracy of the vote count.
Among registered voters, 25 percent are very concerned that the Russians may attempt to influence the election, 31 percent are somewhat concerned, 18 percent not very concerned and 23 percent not at all concerned. Among Democrats, 38 percent are very concerned, with 34 percent somewhat, 16 percent not very and 12 percent not at all concerned about Russian influence. Among Republicans, 15 percent are very concerned about Russian influence in the election, with 29 percent somewhat, 23 percent not very and 32 percent not at all concerned about Russian influence. Twenty-three percent of independents are very concerned, 31 percent somewhat concerned, 18 percent not very concerned and 26 percent not at all concerned about Russian influence in the American election.
New voters
Among all registered voters, 10 percent say this will be the first time they vote in a presidential election. Among Republicans, 8 percent say this will be their first presidential vote, among Democrats 9 percent are new voters, and among independents 14 percent are new voters.
Among new voters who are registered to vote, Clinton and Trump each receive 31 percent, with Johnson getting 14 percent, Stein 11 percent and 14 percent not expressing a preference. Among new likely voters Trump receives 41 percent to Clinton’s 34 percent, Johnson’s 5 percent and Stein’s 8 percent. However, the new-voter samples are too small to be considered reliable estimates. The margin of error is +/-14 percentage points for new likely voters. Among all new voters, the margin of error is +/- 12 percentage points.
Outlook for Congress and party leadership
Asked if it is appropriate for an opposition party in Congress to adopt the attitude that their greatest priority is to ensure that the president is not reelected in 2020, 72 percent of registered voters say that this is not appropriate while 16 percent say it is appropriate. Majorities of each partisan group say such an approach is not appropriate, with 67 percent of Republicans, 73 percent of Democrats and 77 percent of independents saying such an approach is not appropriate. Twenty percent of Republicans, 17 percent of Democrats and 13 percent of independents say such an approach is appropriate.
Asked whom they would rather see lead the Republican party in 2017, 20 percent of registered voters say Trump, 13 percent Sen. Ted Cruz and 51 percent Rep. Paul Ryan. Among Republicans, 36 percent prefer Trump, 16 percent Cruz and 42 percent Ryan. Democrats prefer Ryan by 58 percent to 12 for Cruz and 8 for Trump. Independents prefer Ryan by 53 percent to 13 percent for Cruz and 19 percent for Trump.
Talk about politics
Far more people talk about politics frequently with family and friends than they do at work. Seventy-two percent of registered voters talk at least weekly about politics with family and friends, with 13 percent doing so once or twice a month and 8 percent a few times a year. Six percent never discuss politics. With co-workers, 44 percent talk politics at least weekly, 10 percent once or twice a month and 8 percent a few times a year. Thirty-eight percent never discuss politics with co-workers.
Among all registered voters, 34 percent say they have stopped talking about politics with someone due to disagreements about the election. In 2012, the last polls before the recall election for governor of Wisconsin that June and before the November general election found that 35 percent and 33 percent respectively had stopped talking to someone about politics. Before the November 2014 election, 27 percent said they had stopped talking to someone because of politics.
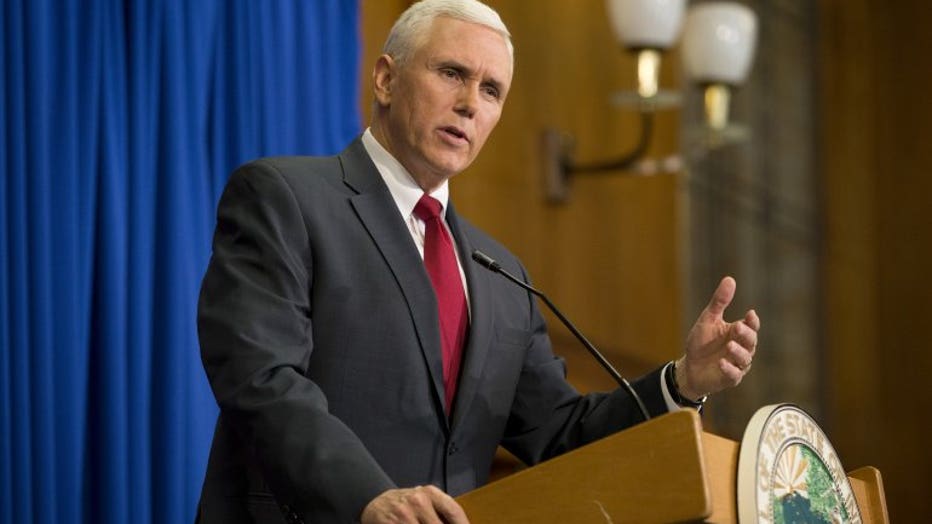
Views of the vice-presidential candidates
Republican vice-presidential candidate Mike Pence is viewed favorably by 37 percent of registered voters and unfavorably by 30 percent, with 33 percent lacking an opinion about him. In the Aug. 4-7 poll following the national party conventions, Pence was viewed favorably by 24 percent and unfavorably by 21 percent, with 55 percent lacking an opinion.
Democratic vice-presidential candidate Tim Kaine is viewed favorably by 27 percent of registered voters and unfavorably by 31 percent, with 42 percent lacking an opinion about him. In the Aug. 4-7 poll, Kaine was viewed favorably by 20 percent and unfavorably by 20 percent, with 60 percent lacking an opinion.
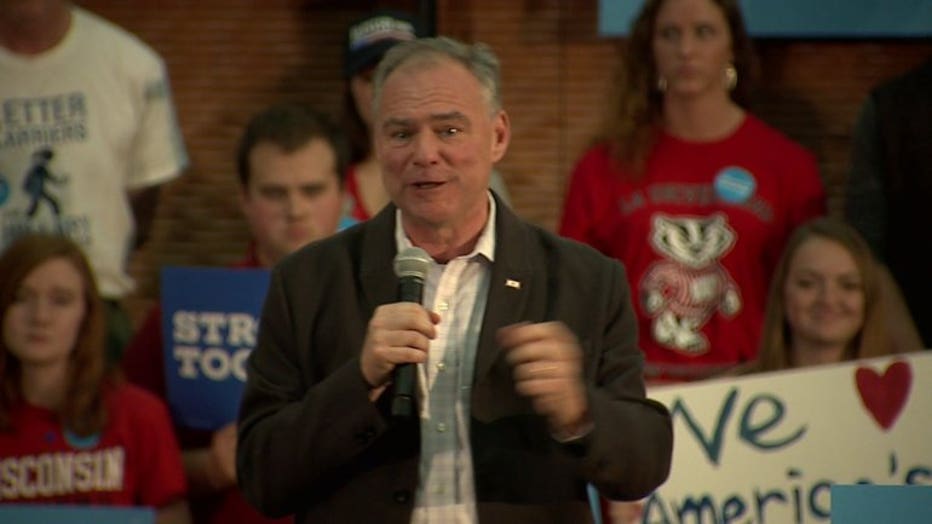
Tim Kaine in Madison
Job approval of Walker and Obama
Approval of how Wisconsin Gov. Scott Walker is handling his job stands at 42 percent, with disapproval at 51 percent among all registered voters. In the Oct. 6-9 poll, approval was 44 percent and disapproval was 51 percent.
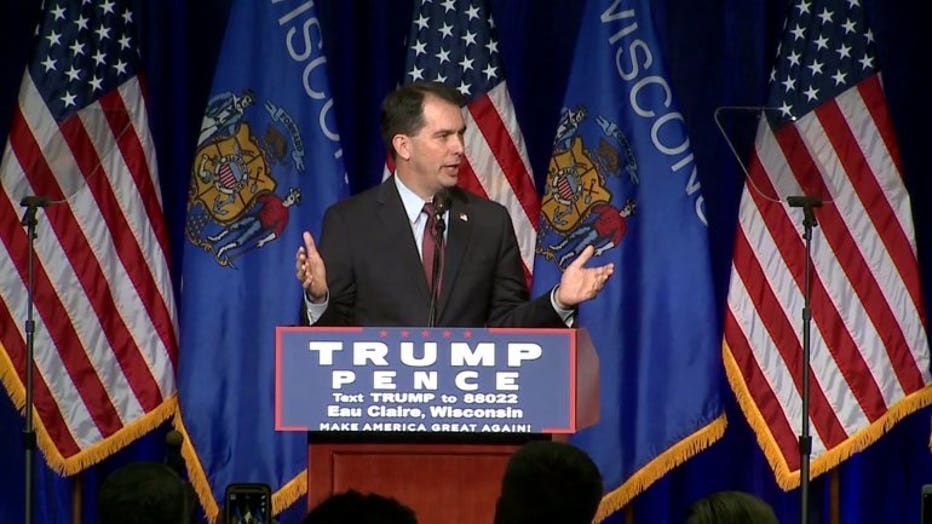
Gov. Scott Walker
President Barack Obama’s job approval stands at 52 percent, with 44 percent disapproval. In the previous poll, 52 percent approved and 43 percent disapproved.
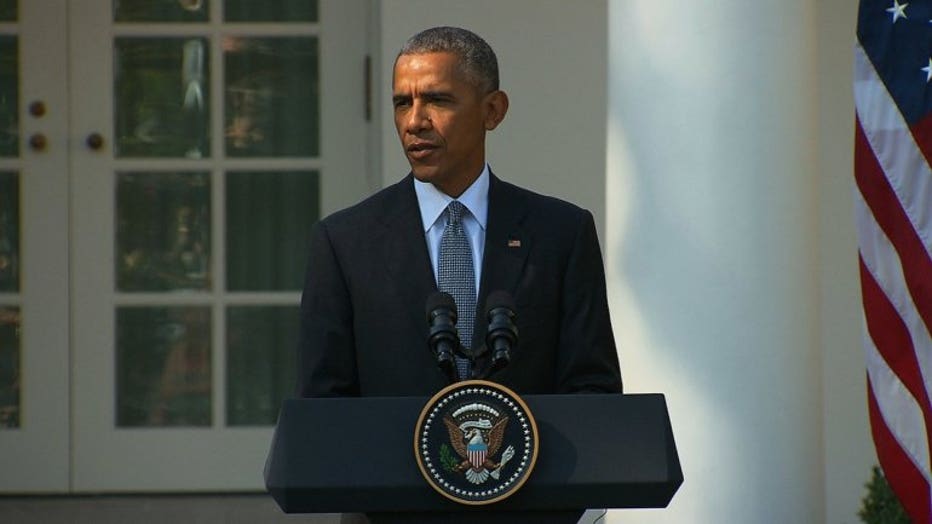
President Barack Obama
About the Marquette Law School Poll
The Marquette Law School Poll is the most extensive statewide polling project in Wisconsin history. This poll interviewed 1,401 registered Wisconsin voters by landline or cell phone, Oct. 26-31, 2016. The margin of error is +/-3.3 percentage points for the full sample. For likely voters, the unweighted sample size is 1,255 and weighted sample size is 1,190, with a margin of error of +/-3.5 percentage points. When broken down by day of interview, the margin of error is +/- 5.3 percentage points for Wednesday and Thursday‘s sample (541 respondents), +/-9.8 percentage points for the Friday sample (157 respondents) and +/-5.4 percentage points for the combined Saturday, Sunday and Monday samples (557 respondents).

The partisan makeup of the full registered-voter sample, including those who lean to a party, is 42 percent Republican, 48 percent Democratic and 8 percent independent. The long-term estimate over the previous 40 statewide Marquette polls, with 34,751 respondents, is 43 percent Republican and 47 percent Democratic, with 9 percent independent. The partisan makeup of this sample, excluding those who lean to a party, is 27 percent Republican, 32 percent Democratic and 37 percent independent, compared to the long-term estimate of 27 percent Republican, 31 percent Democratic and 38 percent independent.
The entire questionnaire, methodology statement, full results and breakdowns by demographic groups are available at law.marquette.edu/poll.