New Marquette Law School Poll shows gap between Clinton, Trump narrowing
MILWAUKEE -- Donald Trump's approval ratings aren't getting much better in Wisconsin, but Hillary Clinton's are getting worse.
A Marquette University Law School poll released Wednesday, August 31st shows that 63 percent of registered voters have an unfavorable view of Trump, down from 65 percent three weeks ago.

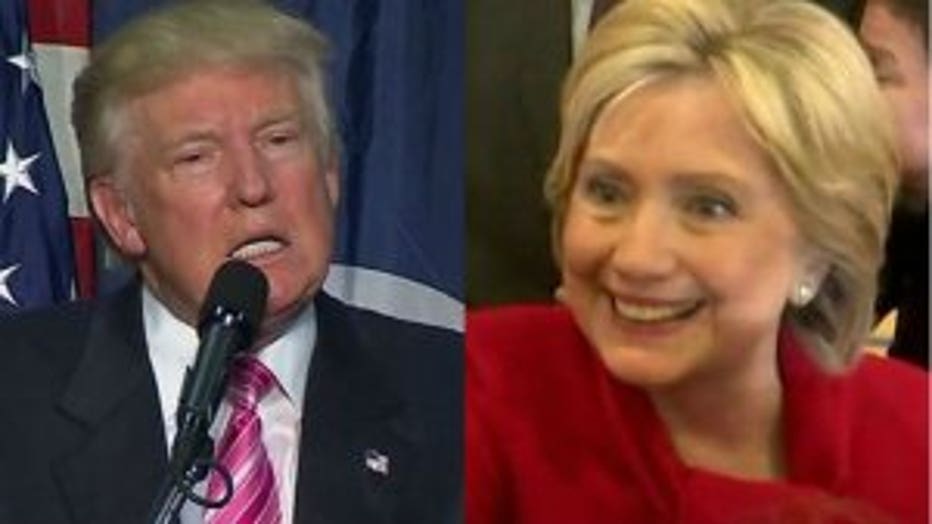
Donald Trump/Hillary Clinton
Clinton's unfavorable rating is at 58 percent, up from 53 percent three weeks ago.
The new poll shows the race between Clinton and Trump to be about even.
Clinton had 42 percent among registered voters compared with 37 percent for Trump. Among likely voters, Clinton had 45 percent compared with 42 percent for Trump.
Meanwhile, with less than 10 weeks to go until the election, about a third of Wisconsin voters say they don't know enough about incumbent Republican Sen. Ron Johnson to form an opinion of him.

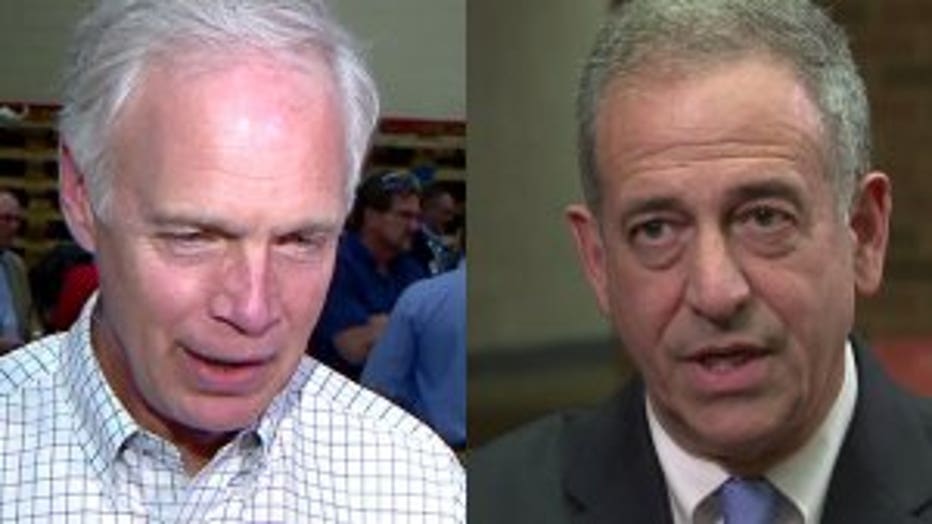
Sen. Ron Johnson, Russ Feingold
And 25 percent say in the Marquette University Law School poll released Wednesday that they don't know enough about Democrat Russ Feingold to make a decision.
Among registered voters, Feingold had 46 percent compared with 42 percent for Johnson. Among likely voters, Feingold had 48 percent while Johnson had 45 percent.
Johnson's campaign released this statement to FOX6 News:
"Senator Feingold is so out of touch he thinks Hillary Clinton is trustworthy, which is why he's been running a dishonest and deceptive campaign all summer with little to show for it. Now he's facing allegations of unethical behavior, and it couldn't be a clearer contrast with Ron Johnson, who has been working hard to protect Wisconsin taxpayers and keep our local communities safe.”
Feingold's campaign released this statement:
"Senator Johnson has spent years in Washington working for big corporate interests and multi-millionaires like himself while Wisconsinites fall behind. So while Russ maintains a consistent lead in the polls, this campaign will continue to prioritize the middle class and working families of this state who want leaders who will listen to and fight for them.
Sen. Johnson will spend the rest of this campaign protecting bad trade deals and tax loopholes for the rich while disparaging single moms and the working families of this state, but Russ will actually listen to their concerns and fight for an economy that works for everyone - not just multi-millionaires like Sen. Johnson."
Gov. Scott Walker's approval rating has rebounded to its highest point in months.
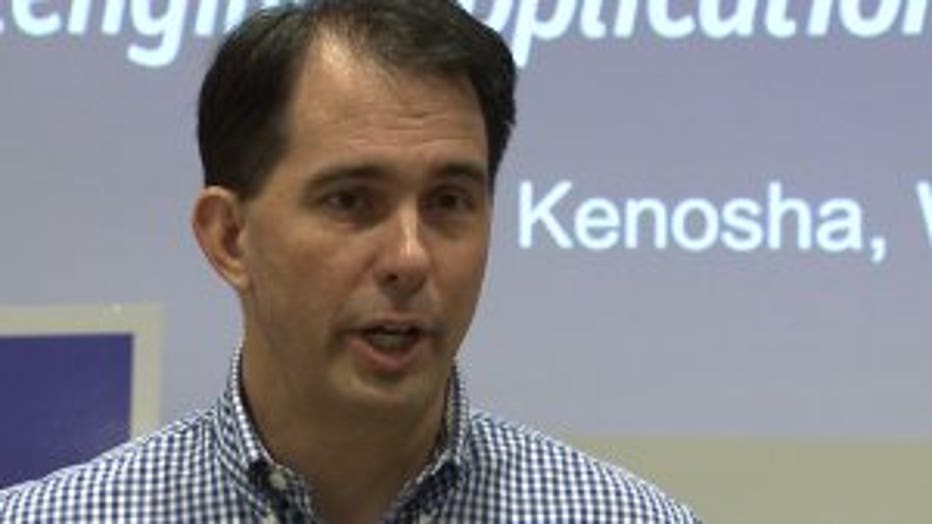
The poll shows Walker's approval at 43 percent. It was 38 percent in a poll three weeks ago, the same as it was in July. It was last at 43 percent in March.

Gov. Scott Walker
Walker's approval rating first fell below 40 percent in August 2015 and has hovered around 40 percent ever since. It dropped to its lowest levels as Walker launched his failed presidential bid and it has not recovered since, even as Walker has emphasized traveling around Wisconsin more.
Below is a complete analysis of the latest Marquette University Law School poll, as released by Marquette officials:

A new Marquette Law School Poll finds Democratic candidate Hillary Clinton with support from 42 percent of Wisconsin registered voters and Republican candidate Donald Trump with support from 37 percent in a head-to-head presidential matchup. Nineteen percent do not express a preference, saying they will vote for neither candidate, will not vote, or don’t know how they will vote.
In the previous Marquette Law School Poll, conducted Aug. 4-7, Clinton was supported by 46 percent of registered voters and Trump by 36 percent, with 16 percent not having a preference. In the July Marquette poll, Clinton received 43 percent support and Trump 37 percent, while 18 percent did not give a preference.
Among likely voters, i.e., those who say they are certain they will vote in November, Clinton is supported by 45 percent and Trump by 42 percent in the new poll, with 10 percent saying they will support neither candidate. In the early August poll, 52 percent of likely voters supported Clinton, while Trump was backed by 37 percent and 10 percent said they had no preference. In July, likely voters gave Clinton 45 percent support and Trump 41 percent, while 14 percent said they lacked a preference.
“After a strong bump in Clinton’s favor following the national party conventions, the electorate in Wisconsin has returned to about where the vote stood in July, prior to the conventions,” said Charles Franklin, director of the Marquette Law School Poll and Professor of Law and Public Policy.
In a four-way matchup including Clinton, Trump, Libertarian candidate Gary Johnson and Green Party candidate Jill Stein, Clinton is supported by 37 percent of registered voters, with Trump at 32 percent, Johnson at 11 and Stein at 7. A total of 13 percent in that matchup do not give a preference. In the four-candidate matchup in early August, Clinton received 42 percent, with Trump at 33 percent, Johnson at 10 and Stein at 4, while another 11 percent did not pick a candidate. In July’s four-candidate question among registered voters, Clinton received 40 percent, Trump 33, Johnson 10 and Stein 4.
Among likely voters, Clinton receives 41 percent, Trump 38, Johnson 10 and Stein 4 with 7 percent lacking a preference. In early August, Clinton received 47 percent of likely voters, with Trump at 34 percent, Johnson at 9 and Stein at 3, while 6 percent lacked a preference. In July, among likely voters, Clinton received 43 percent, Trump 37, Johnson 8 and Stein 2.
In a head-to-head matchup for Wisconsin’s U.S. Senate race among registered voters, Russ Feingold receives 46 percent to Ron Johnson’s 42 percent, with 9 percent lacking a preference. In early August, Feingold had 49 percent and Johnson had 43 percent. In July, Feingold had 48 percent support and Johnson 41 percent.
Among likely voters in November’s election, Feingold has the support of 48 percent while Johnson is supported by 45 percent. In early August, among likely voters Feingold had 53 percent while Johnson held 42 percent. In July, Feingold was supported by 49 percent of likely voters and Johnson by 44 percent.
When Libertarian candidate Phil Anderson is included in the Senate contest, among registered voters, Feingold receives 42 percent, Johnson 38 percent and Anderson 8 percent, with 12 percent not expressing a preference. In early August, Feingold held 47 percent, Johnson 38 percent and Anderson 7 percent. In July, Feingold received 45 percent, Johnson 38 percent and Anderson 8 percent.
Among likely voters in the new poll, Feingold is supported by 45 percent, Johnson by 42 percent and Anderson by 6 percent, with 7 percent not giving a preference. Three weeks ago, Feingold received 50 percent, Johnson 39 percent and Anderson 7 percent among likely voters. In July, Feingold received 46 percent, Johnson 40 percent and Anderson 7 percent.
Likely turnout has fluctuated over the past several polls. In the new poll, 84 percent of Republicans say they are certain to vote, compared to 81 percent of Democrats and 74 percent of independents. In early August, Democrats enjoyed higher likely turnout at 82 percent, compared to 79 percent among Republicans and 69 percent among independents. In July, 86 percent of Republicans and 85 percent of Democrats were certain they would vote, as were 71 percent of independents.
The poll was conducted Aug. 25-28, 2016. The full sample includes 803 registered voters interviewed by cell phone or landline, with a margin of error of +/- 4.5 percentage points. Results for likely voters are based on 650 respondents, with a margin of error of +/- 5.0 percentage points.
Favorable and unfavorable views of candidates
Trump is viewed favorably by 28 percent and unfavorably by 63 percent of registered voters. Eight percent say they either haven’t heard enough or don’t know how they feel about him. In early August, Trump’s rating was 27 percent favorable and 65 percent unfavorable.
Clinton is viewed favorably by 35 percent and unfavorably by 58 percent of registered voters. Seven percent say they haven’t heard enough or don’t know how they feel about her. In early August, 43 percent rated Clinton favorably and 53 percent unfavorably.
Johnson, the Libertarian presidential candidate, is seen favorably by 14 percent and unfavorably by 14 percent, with 72 percent lacking an opinion of him. Three weeks ago, 13 percent had a favorable view of Johnson, 15 percent an unfavorable view and 72 percent lacked an opinion.
In the U.S. Senate race, Feingold is seen favorably by 40 percent of registered voters and unfavorably by 35 percent, with 25 percent lacking an opinion. Johnson has a 33 percent favorable and 34 percent unfavorable rating, with 32 percent without an opinion. Libertarian candidate Anderson is viewed favorably by 4 percent and unfavorably by 4 percent, with 92 percent lacking an opinion of him. In early August, Feingold had a 44 percent favorable and 36 percent unfavorable rating, while Johnson’s was 34 percent favorable and 32 percent unfavorable. In the previous poll, Anderson was at 4 percent favorable and 5 percent unfavorable, with 92 percent having no opinion of him.
Comparison of candidate traits
Among registered voters, 46 percent describe Feingold as someone who “cares about people like me,” while 36 percent say this does not describe him and 17 percent say they don’t know. Thirty-eight percent describe Johnson as someone who cares, with 38 percent saying this does not describe him and 23 percent saying they don’t know. This question about the Senate candidates has not been asked in previous polls.
Asked if “honest” describes Clinton, 26 percent of registered voters say it does while 68 percent say it does not. For Trump, 31 percent of respondents say “honest” describes him while 64 percent say it does not. In early August, 32 percent described Clinton as honest and 64 percent did not. Thirty-three percent described Trump as honest in that poll, while 64 percent did not. In July, 28 percent described Clinton as honest and 68 percent did not, while 33 percent described Trump as honest and 62 percent said this did not describe him.
Forty percent describe Clinton as someone who “cares about people like me” and 54 percent do not. Thirty-one percent say Trump cares about people like them while 65 percent do not see him this way. In early August, 47 percent described Clinton as caring while 51 percent did not. In that poll, 31 percent said Trump cares while 67 percent did not see him that way. This question was not asked in July.
Asked if a candidate has the qualifications to be president, 54 percent say Clinton does, while 44 percent say she does not. Thirty-two percent say Trump has the qualifications to be president while 65 percent say he does not. In early August, 58 percent described Clinton as qualified and 41 percent said she was not, while 29 percent described Trump as qualified and 68 percent said he was not. In July, 56 percent described Clinton as qualified while 42 percent did not, and 32 percent said Trump had the qualifications to be president and 67 percent said that he did not.
Respondents were asked how comfortable they were with the idea of each candidate as president. Forty-one percent say they are very or somewhat comfortable with Clinton as president, with 57 percent very or somewhat uncomfortable, including 45 percent saying they are “very uncomfortable.” For Trump, 32 percent say they are very or somewhat comfortable with him as president while 67 percent say they are very or somewhat uncomfortable, including 52 percent saying “very uncomfortable.”
In early August, 43 percent were comfortable with Clinton and 55 percent were uncomfortable, with 41 percent very uncomfortable. For Trump, 31 percent were comfortable and 68 percent uncomfortable, with 53 percent very uncomfortable. In July, 40 percent were very or somewhat comfortable with Clinton, with 60 percent very or somewhat uncomfortable, including 43 percent “very uncomfortable.” Thirty percent were very or somewhat comfortable with Trump while 68 percent were very or somewhat uncomfortable, including 53 percent very uncomfortable.
Policy toward undocumented immigrants
Sixty-two percent of registered voters say that undocumented immigrants currently working in the United States should be allowed to stay and eventually apply for citizenship. Nineteen percent say they should be allowed to stay but only as temporary guest workers and not allowed to apply for citizenship, and 15 percent say they should be required to leave their jobs and leave the U.S.
In the fall of 2012, combining the results of four polls, 52 percent favored a citizenship path, 20 percent a guest worker status and 21 percent favored requiring undocumented immigrants to leave the country. Combining the results of five polls taken in 2016, 60 percent favor a citizenship option, 20 percent a guest worker option and 17 percent favor requiring undocumented immigrants to leave.
In the current poll, among Republicans, 43 percent favor a citizenship option, 26 percent favor a guest worker policy and 28 percent favor requiring undocumented workers to leave the U.S. Among Democrats, 81 percent favor a citizenship path, 13 percent prefer a guest worker option and 4 percent support requiring the undocumented to leave. Independents favor eventual citizenship by 64 percent, with 17 percent supporting a guest worker program and 15 percent in favor of required exit from the country.
Among those saying they will vote for Trump, 39 percent favor a path to citizenship, 29 percent prefer a guest worker status and 31 percent favor requiring undocumented workers to leave the U.S. Among Clinton voters, 82 percent favor a path to citizenship, 14 percent support a guest status and 3 percent say undocumented immigrants should leave the country.
Among registered voters, 68 percent say Trump favors requiring undocumented immigrants to leave the U.S., 14 percent say he favors a guest worker option and 9 percent say he supports a path to citizenship, with 8 percent saying they don’t know his position. In contrast, 70 percent say Clinton favors a path to citizenship, 15 percent say she favors a guest worker program and 2 percent say she favors requiring undocumented immigrants to leave, while 13 percent say they do not know her position on this issue.
Asked if Trump has changed his position on undocumented immigrants recently, 47 percent say he has changed, 39 percent say he has held his position all along and 13 percent don’t know. For Clinton, 19 percent say she has changed her position while 54 percent say she has held the same position and 26 percent don’t know if she has changed.
Among those who support Trump in the head-to-head matchup, 49 percent say he has changed his position while 37 percent say he has not changed. Among those Trump supporters who think he has not changed, 72 percent say he would require undocumented immigrants to leave the U.S., 15 percent say he would support a guest worker policy and 12 percent think he favors a path to citizenship. Among those Trump supporters who think he has recently changed positions, 36 percent say he now favors requiring the undocumented to leave, while 36 percent say he favors a guest worker option and 21 percent say he now supports a path to citizenship.
Personal situation and vote
Fifty-three percent of registered voters say they are living comfortably, 33 percent say they are just getting by and 13 percent say they are struggling. Among those living comfortably, Trump receives 43 percent to Clinton’s 38 percent in the head-to-head matchup. Among those just getting by or struggling, Trump is supported by 31 percent to Clinton’s 47 percent. When limited to only non-Hispanic white voters, Trump receives 45 percent to Clinton’s 35 percent among those living comfortably while those just getting by or struggling support Clinton 39 percent to Trump’s 36 percent.
Among registered voters with incomes over $75,000, Trump receives 49 percent to Clinton’s 35 percent. Among those with incomes between $40,000 and $75,000, Trump is supported by 41 percent and Clinton by 40 percent. Among those earning less than $40,000, Trump receives 26 percent support to Clinton’s 54 percent. A similar pattern holds among non-Hispanic white voters, with Trump getting 50 percent to Clinton’s 35 percent among those earning over $75,000. Trump is supported by 45 percent to Clinton’s 35 percent of non-Hispanic white voters earning between $40,000 and $75,000. Among non-Hispanic white voters earning less than $40,000, Trump receives 31 percent support to Clinton’s 43 percent.
Nearly half (49 percent) of registered voters think the next generation will have a worse life than today, while 20 percent think it will be better and 25 percent say the next generation will live in about the same circumstances as today. Those who see a worse future support Trump 49 percent to 30 percent for Clinton. Those who think the future will be better support Clinton 62 percent to 24 percent for Trump, and those who think the future will be about the same support Clinton 53 percent and Trump 24 percent.
Civil unrest in Milwaukee
More than half of registered voters, 51 percent, say they have read or heard “a lot” about the recent civil unrest in Milwaukee after a police officer shot and killed an armed man. Twenty-nine percent say they have read or heard “some” and 15 percent “only a little,” while 4 percent have heard nothing at all.
Asked about their feelings about the police in their community, 86 percent say the police make them feel mostly safe while 12 percent said they feel mostly anxious. Among non-Hispanic white respondents, 90 percent say police make them feel mostly safe and 9 percent say mostly anxious. Among black and Hispanic respondents, 57 percent say police make them feel mostly safe and 37 percent say mostly anxious.
Statewide, 37 percent said the unrest was mostly due to anger at decades of disadvantage for black communities while 48 percent said it was mostly due to lack of respect for law and order.
The state of the state
Approval of how Wisconsin Gov. Scott Walker is handling his job stands at 43 percent, with disapproval at 49 percent. In early August, approval was 38 percent and disapproval was 59 percent. Walker’s approval matches his recent high mark of 43 percent in March, while this is the first time disapproval has been under 50 percent since October 2014.
President Obama’s job approval stands at 49 percent, with 45 percent disapproval. In early August, 53 percent approved and 41 percent disapproved.
About the Marquette Law School Poll
The Marquette Law School Poll is the most extensive statewide polling project in Wisconsin history. This poll interviewed 803 registered Wisconsin voters by landline or cell phone, Aug. 25‑28, 2016. The margin of error is +/- 4.5 percentage points for the full sample. For likely voters, the unweighted sample size is 650 and weighted sample size is 615, with a margin of error of +/-5.0 percentage points.
The partisan makeup of the full registered-voter sample, including those who lean to a party, is 45 percent Republican, 46 percent Democratic and 7 percent independent. The long-term estimate over the previous 36 statewide Marquette polls, with 32,146 respondents, is 42 percent Republican and 48 percent Democratic, with 9 percent independent. The partisan makeup of this sample, excluding those who lean to a party, is 27 percent Republican, 30 percent Democratic and 38 percent independent, compared to the long-term estimate of 27 percent Republican, 31 percent Democratic and 38 percent independent.
The entire questionnaire, methodology statement, full results and breakdowns by demographic groups are available at law.marquette.edu/poll.
Also released on Wednesday, the Monmouth Poll in Wisconsin shows Hillary Clinton leading Donald Trump 43-38 among likely voters. It also shows Russ Feingold well ahead of Ron Johnson, 54-41, in the Wisconsin U.S. Senate race. CLICK HERE to read more about the Monmouth Poll.


