The 10 most popular occupations for Uber and Lyft drivers
MILWAUKEE -- Uber and Lyft have revolutionized the taxi industry by allowing individuals to work as freelance drivers-for-hire, using their personal vehicles. Drivers can set their own hours and earn money on the side with little to no upfront expense. It’s not surprising that millions of drivers have chosen to join Uber, Lyft, or both.
On the other hand, most drivers who do work for Uber and/or Lyft do so as a side gig, while working either part-time or full-time at a “day job” of some sort. While reports differ on how much money ridesharing drivers really make, a recent study conducted by MIT’s Center for Energy and Environmental Policy Research determined that Uber and Lyft drivers earn a median hourly profit of $8.55.
Car insurance comparison site Insurify analyzed its website’s visitor data to find out which occupations have the most employees rideshare-driving as an extra source of income. Here is what Insurify found.
Methodology
Insurify provides car insurance quotes based on insurance applicants’ answers to questions about driving history, vehicle type, and other demographic data. The rankings in this article are based on a set of 1.3 million auto insurance shopper applications, in which visitors were asked for their profession and also if they used their vehicles to drive for Uber or Lyft. Information on wages and employment was provided by the Bureau of Labor Statistics, 2017 National Occupational Employment and Wage Estimates. The mean hourly wages and total employment numbers shown are representative of all U.S. employees within the given occupation. They are not specific to those driving for ridesharing services.

Photo Credit: Wikimedia Commons
10. Fitness Trainers
Percent also driving for Uber / Lyft: 1.41%
Total number of people employed: 280,080
Mean hourly wage: $21.02
Fitness trainers and aerobics instructors don’t make a huge salary. The best money for trainers is in the performing arts / sports promoters industry, which produces a mean hourly wage of $31.74 for these occupations. However, the majority of trainers are in the recreation industry with a much lower mean wage of $21.59.

Photo Credit: PIXNIO
9. Photographers
Percent also driving for Uber / Lyft: 1.42%
Total number of people employed: 49,320
Mean hourly wage: $20.17
Over half of all photographers are in the professional, scientific, and technical services industry, which pays them a mean hourly wage of $18.61. The highest-paying industry for this occupation is aerospace, with a relatively high mean wage of $37.00. Unfortunately, only a tiny percentage of photographers are in this industry. Hawaii and Florida have the highest concentration of photographers in the U.S.

Photo Credit: Wikimedia Commons
8. Tutors
Percent also driving for Uber / Lyft: 1.44%
Total number of people employed: 905,550
Mean hourly wage: $17.65
According to Glassdoor, certified tutors report an average base pay of just over $26,000 per year. Assuming a full-time schedule, that’s just $12.50 per hour, even less than the number reported by the BLS – and that was already the lowest mean hourly wage from this list. On the other hand, the 2017 employment numbers from the BLS were by far the highest of all the occupations on this list.

Photo Credit: Wikimedia Commons
7. Reporters
Percent also driving for Uber / Lyft: 1.49%
Total number of people employed: 38,790
Mean hourly wage: $24.79
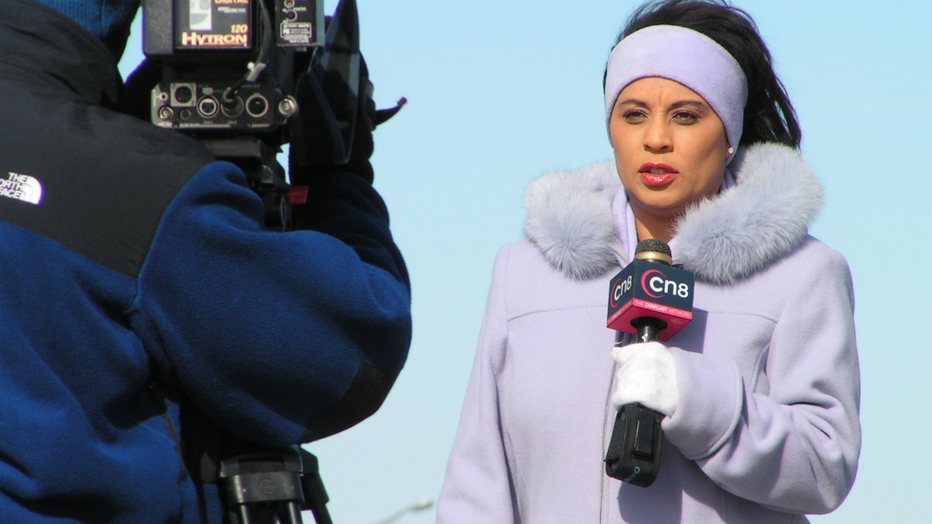
Over half of all reporters work in the magazine and newspaper publishing industry, which provides an hourly mean wage for them of $21.14. The BLS employment numbers for reporters are the lowest of any occupation on this list. District of Columbia has the highest number of reporters employed per thousand jobs at 2.76.

Photo Credit: Pexels
6. Personal Investors
Percent also driving for Uber / Lyft: 1.66%
Total number of people employed: Unknown
Mean hourly wage: Varies
Personal investors are people who make their money through investing – be it stocks, bonds, or more exotic types of assets. Many day-trade, which is a high-risk, high-return form of investing. The variability and personal nature of this occupation makes it hard to pin down specific employment data, but the fact that personal investors landed in the sixth spot makes it clear that quite a few of them are turning to rideshare driving for extra cash.
Photo Credit: Wikimedia Commons
5. Musicians / Singers
Percent also driving for Uber / Lyft: 1.78%
Total number of people employed: 40,170
Mean hourly wage: $35.86
Musicians and singers make very different salaries depending on the industry they work for. The highest wages come to those in the sound recording industry, at a mean hourly wage of $41.79. The greatest concentration of musicians is found in performing arts companies, followed by religious organizations. Hawaii has the highest concentration of musicians, followed by New York.
Photo Credit: Wikimedia Commons
4. Producers
Percent also driving for Uber / Lyft: 1.87%
Total number of people employed: 117,520
Mean hourly wage: $43.64
The BLS groups producers and directors into a single occupational category, which makes it difficult to determine employment averages for producers alone. Looking at the category as a whole, the most money goes to those working independently, who receive a mean wage of $56.13 per hour. Even in other industries, this occupation does quite well financially; the mean hourly wage is the highest of any occupation on this list. Most producers and directors are in the motion picture industry, with the second largest concentration in radio and TV. Not surprisingly, you’ll find nearly half of all U.S. producers and directors clustered in California and New York.

Photo Credit: Wikimedia Commons
3. Web Developers
Percent also driving for Uber / Lyft: 2.06%
Total number of people employed: 125,890
Mean hourly wage: $35.63
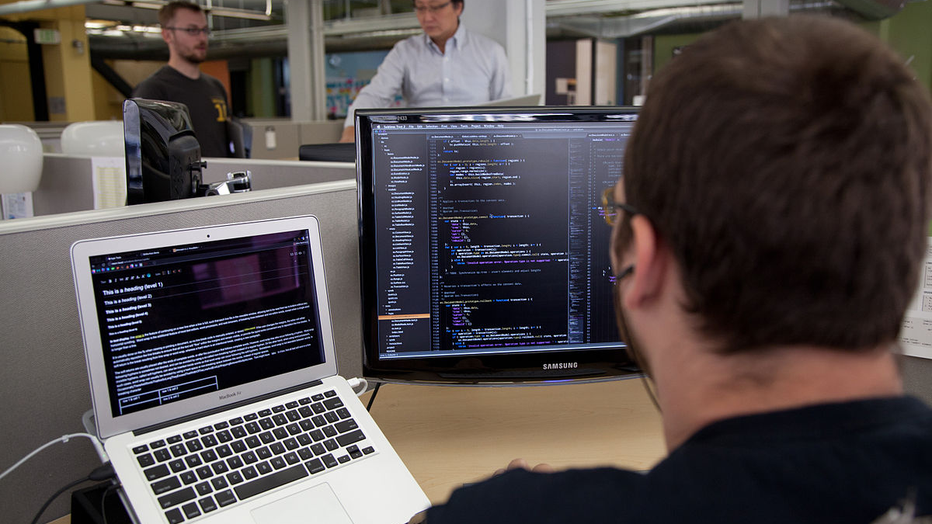
Web developers build the technical parts of websites. Interestingly, the best-paying web developer jobs are in the rental and leasing services industry, which boasts a whopping $51.27 as its hourly mean wage for this occupation. But only a very small percentage of web developers are in that particular industry; the biggest subset is in computer systems design, which enjoys a still-respectable mean wage of $35.61 per hour.

Photo Credit: freepik
2. Travel Agents
Percent also driving for Uber / Lyft: 2.23%
Total number of people employed: 67,330
Mean hourly wage: $19.64
Despite the increase in popularity of travel booking websites like Expedia and Orbitz, there are still a large number of travel agents working in the United States. Agents in the scheduled air transportation industry make the highest mean wage, at $27.72. However, the vast majority of travel agents are in the travel and reservation services industry, with an hourly mean wage of just $19.46. Hawaii and Florida have the highest concentration of travel agents.
Photo Credit: Wikipedia
1. Actors
Percent also driving for Uber / Lyft: 3.71%
Total number of people employed: 43,470
Mean hourly wage: $32.89
Topping this list are actors, with nearly 4% doing some Uber or Lyft driving on the side. Not surprisingly, this occupation is most common in the motion picture and performing arts industries, followed by those working independently. Bizarrely, the fourth most common industry for actors is the accounting, tax preparation, and bookkeeping sector. The highest mean wage goes to actors in the advertising industry, at $42.35 per hour. By far, the biggest share of actors are in California, with New York a distant second.

