Wisconsin Plant Hardiness Zone changes; what it means for you
Updated 2023 USDA Plant Hardiness Zone Map for southeast Wisconsin
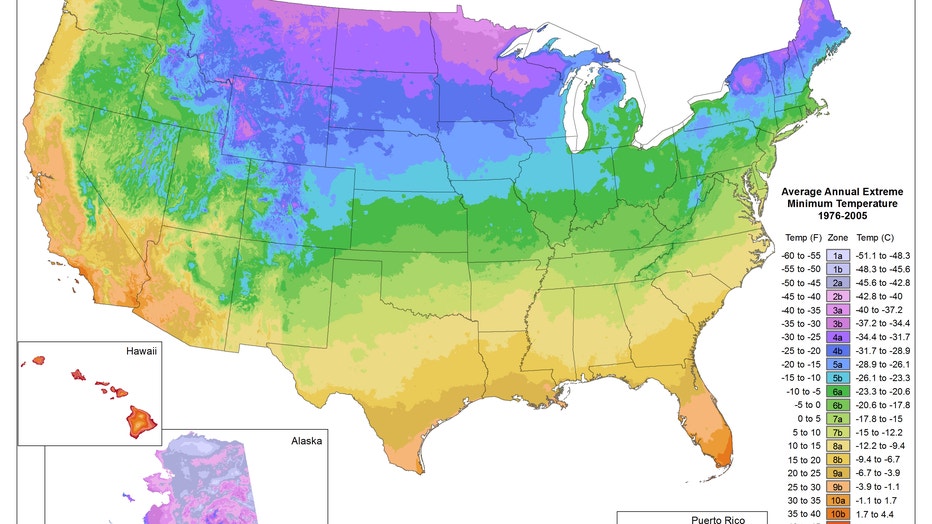
MILWAUKEE - The USDA recently released the updated 2023 Plant Hardiness Zone Map, which indicates the average minimum low temperature an area can experience on a yearly basis.
Just about all of Wisconsin has seen changes in some way from the 2012 version. Most noticeably, Chicago through Sheboygan is considered zone 6a from 5b, and a majority of southeast Wisconsin is now 5b from 5a inland of Lake Michigan.
These maps are often printed on the back of seed packets or other plant nurseries products. Reasons for the change listed in the release include more temperature data points used, finer grid spacing, and an updated 30-year average temperature range.
SIGN UP TODAY: Get daily headlines, breaking news emails from FOX6 News
While a warming climate is likely to blame for the 30-year average temperatures increasing, the map changes interestingly along Lake Michigan could also be from finer grid spacing (using a finer brush for classification). Lake Michigan water temperatures usually keep areas warmer in the winter and cooler in the summer. This new mapping indicates the more realistic microclimate that has always been present, just not indicated by the broader 2012 map.
Our average minimum low temperature now is down from -15 degrees to -10 degrees, to now -10 degrees to -5 degrees in Milwaukee. Five degrees might not sound like a lot, but bitter cold snaps are a key component to warding off invasive species. The emerald ash borer, woolly adelgid and numerous other plants and insects get killed off in extreme cold. With milder winters, invasive species are more likely to survive and to continue to spread into untouched regions.

2012 USDA Plant Hardiness Zone Map
More directly, a changing USDA map will impact what you can grow. Tropical or less hardy species are more likely to survive in a higher zone classification. Native species to the state have the highest likelihood of survival regardless of temperature as they've evolved here for thousands of years to handle the extremes Wisconsin can throw at them.
The full interactive map can be found on the USDA website.

